My Location: OH


Scatter Plots8th Grade |
|
|---|---|
Texas Essential Knowledge and Skills (TEKS): 8.5.c |
|
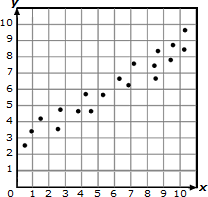
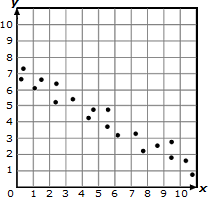
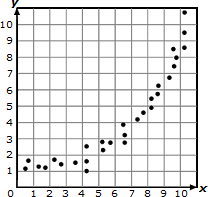
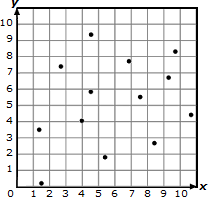
contrast bivariate sets of data that suggest a linear relationship with bivariate sets of data that do not suggest a linear relationship from a graphical representation; |
|
Texas Essential Knowledge and Skills (TEKS): 8.5.d |
|
use a trend line that approximates the linear relationship between bivariate sets of data to make predictions; |
|
Texas Essential Knowledge and Skills (TEKS): 8.11.a |
|
construct a scatterplot and describe the observed data to address questions of association such as linear, non-linear, and no association between bivariate data; |
|
Florida - Benchmarks for Excellent Student Thinking: MA.8.1.1 |
|
Given a set of real-world bivariate numerical data, construct a scatter plot or a line graph as appropriate for the context. |
|
Florida - Benchmarks for Excellent Student Thinking: MA.8.1.2 |
|
Given a scatter plot within a real-world context, describe patterns of association. |
|
Florida - Benchmarks for Excellent Student Thinking: MA.8.1.3 |
|
Given a scatter plot with a linear association, informally fit a straight line |
|
 8th Grade Math - Scatter Plots Lesson